National Engineering Handbook: Chapter 16 - Hydrographs: Difference between revisions
Rmanwaring (talk | contribs) No edit summary |
No edit summary |
||
| Line 15: | Line 15: | ||
|link= | |link= | ||
<!-- Add Url to document below (To retrieve URL from a pdf, add document as a pdf file and copy link address from its page--> | <!-- Add Url to document below (To retrieve URL from a pdf, add document as a pdf file and copy link address from its page--> | ||
https:// | https://damtoolbox.org/images/5/5a/NEH16.pdf | ||
|abstract= | |abstract= | ||
Latest revision as of 23:18, 16 December 2022
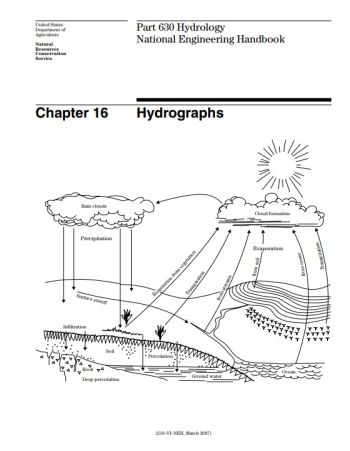
Natural Resources Conservation Service, 2007

Hydrographs or some elements of them, such as peak rates, are used in the planning and design of water control structures. They are also used to show the hydrologic effects of existing or proposed watershed projects and land use changes.
Runoff occurring on uplands flows downstream in various patterns. These patterns of flow are affected by many factors including:
- spatial and temporal distribution of rainfall
- rate of snowmelt
- hydraulics of streams
- watershed and channel storage
- geology and soil characteristics
- watershed surface and cover conditions
The graph of flow (rate versus time) at a stream section is called a hydrograph, of which no two are exactly alike. Computation methods for computing peak rates of flow are based upon empirical relations, starting with the Rational Method for peak discharge in the 19th century, progressing to the unit hydrograph in the 1930s, and then to more recent use of dimensionless or index hydrographs. The empirical relations are simple elements from which a hydrograph may be made as complex as needed.
Revision ID: 5889
Revision Date: 12/16/2022
